Develop with Intellij
Introduction
Goal
Use the IntelliJ IDE to work on Bloomreach Experience Manager implementation projects.
Background
Once you have set up and built your project, you probably want to use your IDE to edit the source files and debug your site. This document explains the steps involved in setting up Intellij for this purpose.
IntelliJ Plugins
Shared Lib Plugin for IntelliJ
This plugin is useful for deploying Bloomreach Experience Manager projects to an external Tomcat instance from within IntelliJ. It deploys Bloomreach Experience Manager's shared dependencies to Tomcat's shared library.
Import an Existing Project
From the "File" menu, choose "Open..."
Select the folder that contains your project and click OK.
From the "File" menu, choose "Project Structure..."
Make sure the Project SDK is 1.8 (i.e. Java 8) and click OK.
Enabling Code Completion for FreeMarker Templates
IntelliJ supports code completion for FreeMarker templates. The default module for FreeMarker templates is repository-data/webfiles. If you add the "Web Application" framework to this module, Intellij will give code completion for typed variables and HST tags.
To enable auto completion for the HST tag library and HST content beans, perform the following steps:
- Add Web Application framework support to the repository-data/webfiles sub project. Do this by right-clicking in the project structure on the folder repository-data/webfiles, then select "Add Framework Support", then select "Web Application" and de-select "Create web.xml". IntelliJ then also creates a folder "web" with a sample jsp file, both can be deleted.
- Create a new FreeMarker template, for instance repository-data/webfiles/src/main/resources/site/helloworld.ftl and fill it with:
<#assign hst=JspTaglibs["http://www.hippoecm.org/jsp/hst/core"] >
<@hst.defineObjects />

<#-- @ftlvariable name="document" type="org.example.beans.BaseDocument" -->

<a href="<@hst.link hippobean=document />">${document.path}</a>
IntelliJ will now generate code completion suggestions for the HST tags, and also for the document variable based on the content bean class.
Debug Your Project
By default, debugging is enabled when running your project using
mvn -P cargo.run
All you need to do, is to attach a debugger to the running application and you can start setting break points.
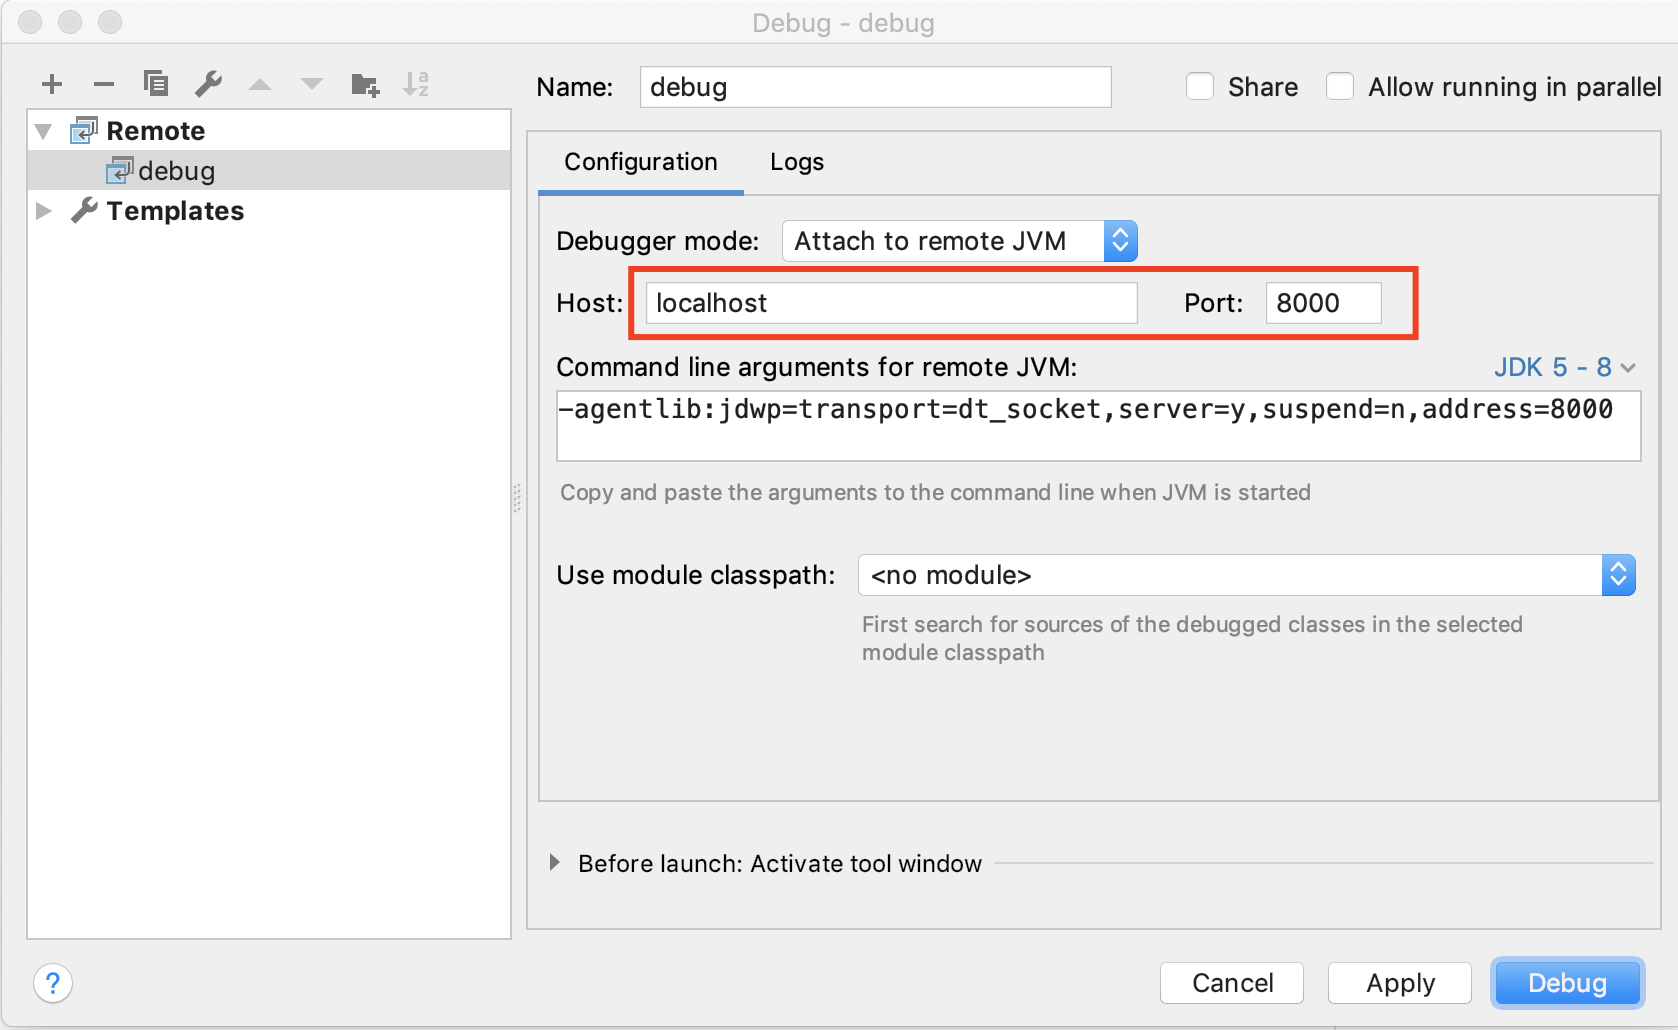
To attach a debugger to a running Bloomreach Experience Manager project follow these steps:
From the "Run" menu, choose "Debug..." or alternatively hit Alt+Shift+F9
Choose "Edit configurations..."
Press the + button on the far left top corner of the dialog that appears and choose "Remote"
Fill in a name for the configuration and make sure the port number is 8000

Click "Apply" and then "Debug" to attach the debugger to the running project.
Note that when the debugger cannot connect and gives an error after some timeout, you can try 127.0.0.1 as host instead.
This page was written using Intellij version 2018.3.

